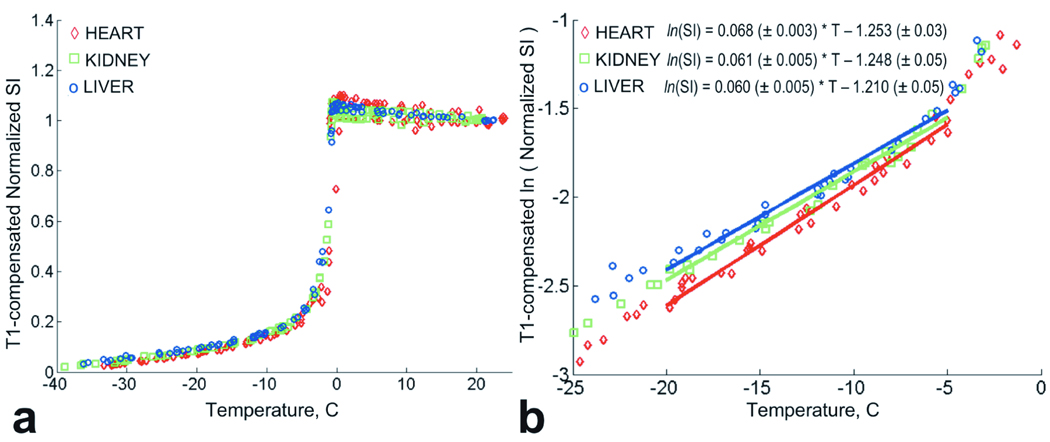
Figure 3.
a. T1-compensated normalized signal intensity for heart, kidney and liver tissue grouped by tissue type. b. Natural logarithm of T1-compensated normalized signal intensity for heart, kidney and liver tissues grouped by tissue type. Solid lines indicate linear fits to the ln(normalized SI) for temperature interval [−20°C ; −5°C].

