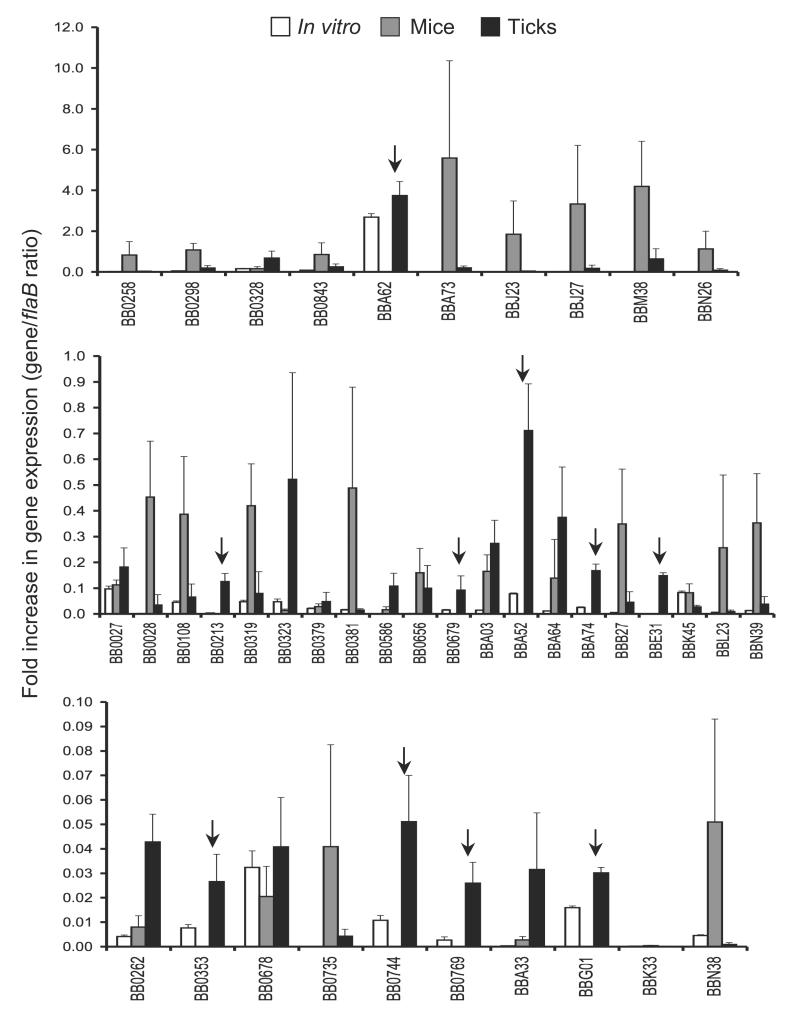
Figure 1. Relative expression levels of selected B. burgdorferi genes in feeding ticks during transmission.
Total RNA was isolated from cultured spirochetes, from pooled B. burgdorferi infected nymphs collected at 24, 48 and 96 hours of feeding on naïve mice and from murine skin following 2 weeks of B. burgdorferi infection, and converted to cDNA for measuring gene-specific transcripts using qRT-PCR. Fold increase in the expression of individual genes in each of the tick or murine samples was calculated based on threshold cycle (Ct) values using the 2−ΔΔCt method normalized against flaB Ct values. Upper, middle and lower panels represent genes with the highest, moderate and lowest expression ratios relative to that of flaB. Bars indicate the mean ± SD from four qRT-PCR analyses of two independent infection experiments. Arrows indicates genes that are highly expressed in feeding ticks but remain undetectable in the murine dermis.

