
Figure 1.
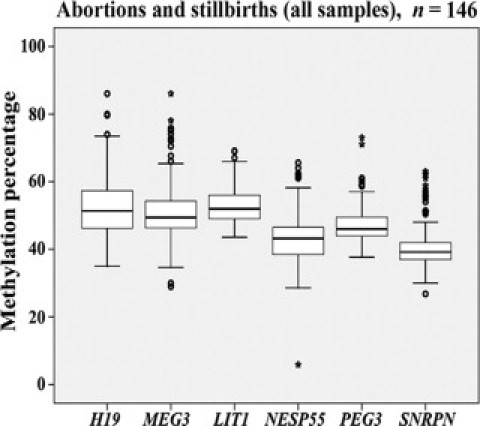
Methylation values of imprinted genes in 146 fetal muscle samples from abortions and stillbirths. The box plots show the distribution of DMR methylation values for H19, MEG3, LIT1, NESP55, PEG3, and SNRPN, respectively. The median is represented by horizontal lines. The bottom of the box indicates the 25th percentile, the top the 75th percentile. Outliers are shown as open circles, extreme outliers as stars.