
Figure 4.
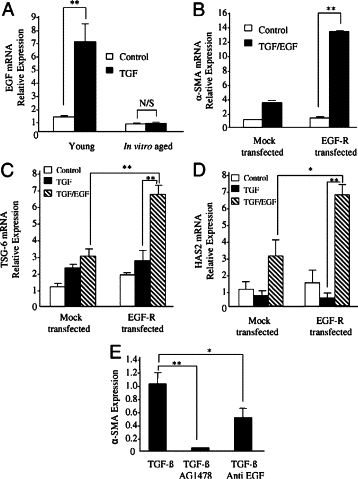
Effect of age on EGF expression (A), synergistic effects of TGF-β1 and EGF in EGF-R-overexpressed aged cells (B–D), and effect of EGF inhibition on phenotypic activation (E). A: Confluent monolayers of patient matched young and aged dermal fibroblasts were growth-arrested in serum-free medium for 48 hours, before addition of either serum-free medium alone (white bars) or serum-free medium containing 10 ng/ml TGF-β1 (black bars) for 72 hours. Total mRNA was extracted, and EGF expression was assessed by RT-Q-PCR. B–D: Aged dermal fibroblasts were transfected either with EGF-R-pCR3.1 (EGF-R transfected) or GFP (mock transfected). Transfection efficiency of cells expressing EGF-R-pCR3.1 was calculated as 42.6% (data not shown). B: 48 hours after transfection, cells were incubated in either serum-free medium alone (white bars) or serum-free medium containing 10 ng/ml TGF-β1 in combination with EGF (10 ng/ml) (black bars) for 72 hours, and α-SMA expression was assessed by RT-Q-PCR. C and D: 48 hours after transfection, cells were incubated in either serum-free medium alone (white bars), serum-free medium containing 10 ng/ml TGF-β1 (black bars), or serum-free medium containing TGF-β1 (10 ng/ml) in combination with EGF (10 ng/ml) (gray bars) for 72 hours. TSG-6 (C) and HAS2 (D) mRNA expression was assessed by RT-Q-PCR. E: confluent monolayers of dermal fibroblasts were growth-arrested in serum-free medium for 48 hours. The medium was replaced with serum-free medium containing TGF-β1 (10 ng/ml) alone or in combination with either the EGF-R inhibitor AG1478 (10 μmol/L) or anti-EGF antibody (10 μg/ml) for 72 hours, and α-SMA expression was assessed by RT-Q-PCR. Ribosomal RNA expression was used as an endogenous control, and gene expression was assessed relative to in vitro aged control cells (A), mock-transfected control cells (B–D), or untreated cells (E). The comparative CT method was used for relative quantification of gene expression, and the results represent the mean ± SE of six individual experiments using cells isolated from two different donors. Statistical analysis was performed by Student's t-test: *P < 0.05; **P < 0.01. N/S, not significant.