
Figure 5.
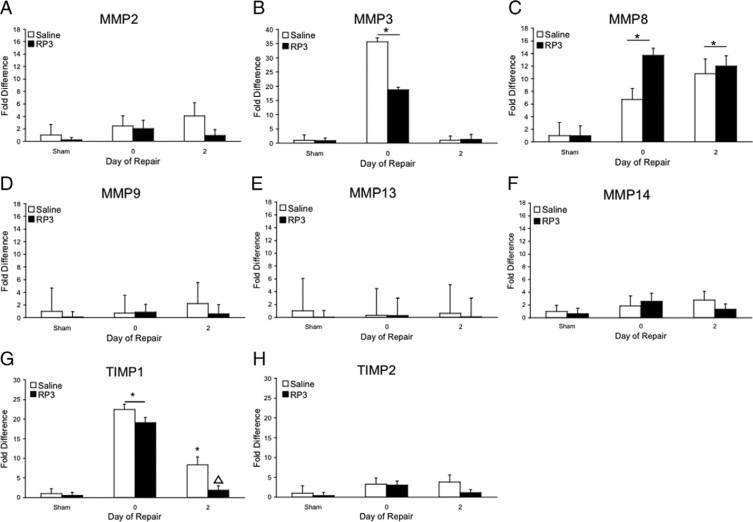
Quantitative real-time RT-PCR. MMP2 (A), MMP3 (B), MMP8 (C), MMP8 (D), MMP13 (E), MMP14 (F), TIMP1 (G), and TIMP2 (H) RNA expression was quantified in liver homogenates derived from sham, injured, and repairing animals following saline or RP3 treatment. Data are relative to 18S expression and are given as fold increases over saline sham. Significant increases over saline sham (∗P ≤ 0.05) are noted. ▵ represents significant difference in TIMP-1 expression (P < 0.05) from control repairing animals.