
Figure 2.
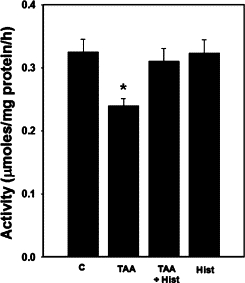
Brain glutamine synthetase activity in ALF rat. Values were mean ± SEM of triplicate measurements in samples obtained from four separate animals in each experimental group. *P < 0.01 versus control (C). There was no statistical difference between TAA versus TAA+ Hist.