
Figure 4.
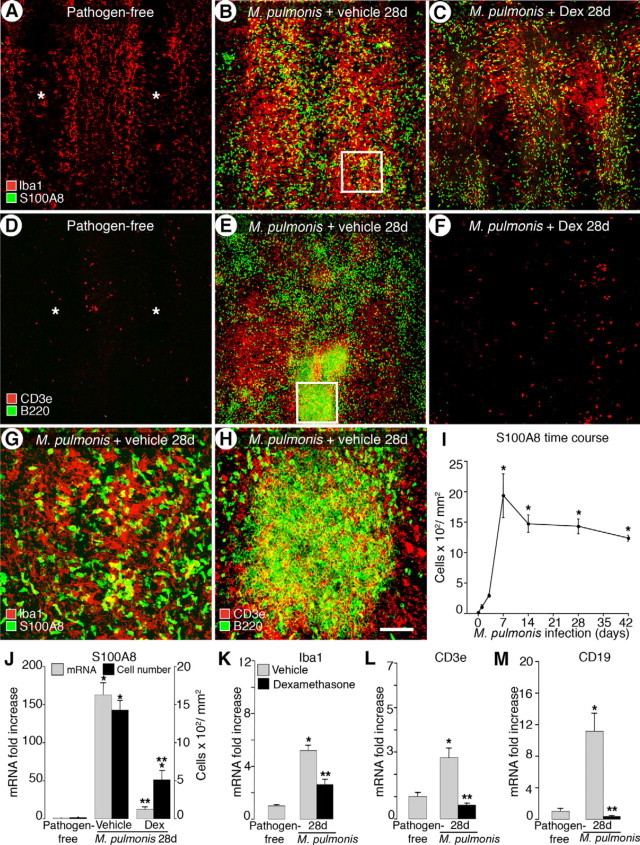
Differential prevention of leukocyte influx into infected airways by dexamethasone. Confocal microscopic images of tracheas stained for markers of macrophages (Iba1, red in A–C) and neutrophils (S100A8, green in A–C) or T cells (CD3e, red in D–F) and B cells (B220, green in D–F) in pathogen-free mice (A and D) and mice infected for 28 days with concurrent treatment with vehicle (B and E) or dexamethasone (C and F). Asterisks indicate cartilage rings in A and D. Boxes in B and E are enlarged in G and H, respectively. Scale bars: 200 μm in (A–F); 50 μm (G–H). I: Time course of influx of S100A8-immunoreactive cells during infection. J: Number of S100A8-immunoreactive cells and qRT-PCR analysis of S100A8 mRNA expression in pathogen-free mice and after infection for 28 days with concurrent treatment with vehicle or dexamethasone. K–M: qRT-PCR measurement for Iba1, CD3e, and CD19 (B-cell marker). *P < 0.05 versus pathogen-free; **P < 0.05 versus the corresponding infected, vehicle-treated controls (n = 4 to 9 mice per group).