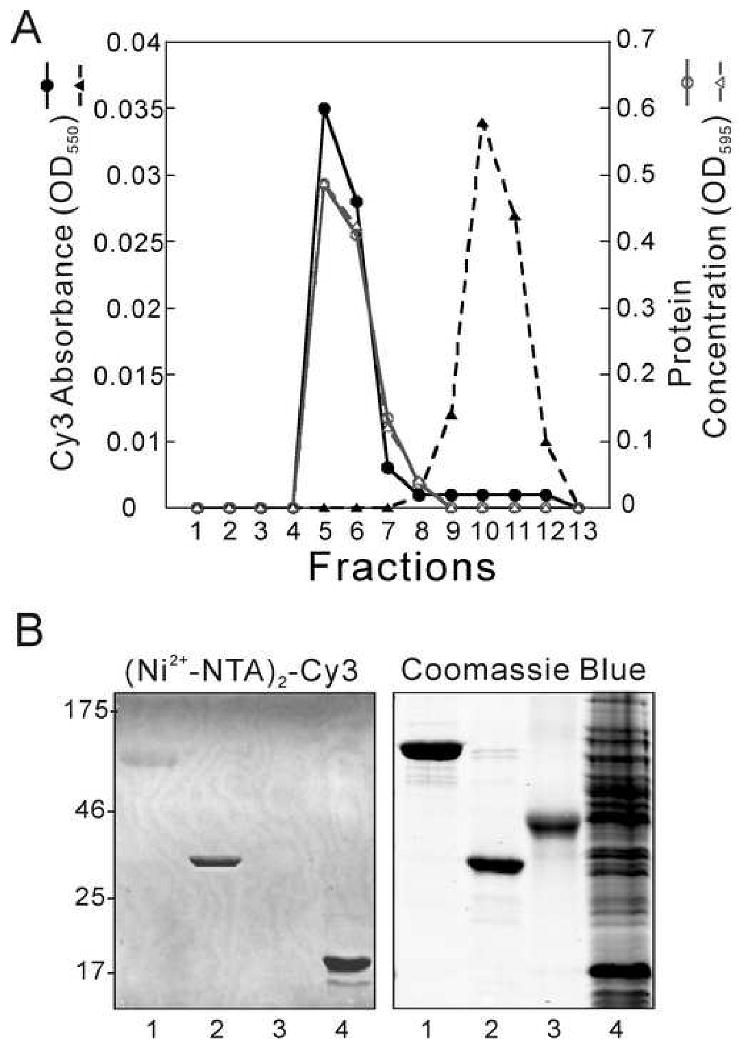
Figure 1. Specific interactions of (Ni2+-NTA)2-Cy3 with His6-proteins.

(A) Analytical chromatography on Sephadex G-50. His6-NSF or un-tagged NSF were pre-incubated with (Ni2+-NTA)2-Cy3 at a 1:1 dye:NSF hexamer ratio. Elution was monitored at 550 nm (black solid line for His6-NSF; black dashed line for NSF) and using the Bradford protein assay [28] at 595 nm (gray solid line for His6-NSF; gray dashed line for NSF). (B) Detection of His6-proteins after SDS-PAGE. Samples were prepared and electrophoresis was performed as described. Samples were His6-NSF (0.06 nmol, 5 μg, Lane 1), α-SNAP (0.23 nmol, 8 μg, Lane 2), ovalbumin (0.11 nmol, 5 μg, Lane 3) and E. coli cell extract containing His6-AdaC protein (total protein 50 μg, Lane 4). Left panel: fluorescence image of gel (λex = 532 nm, λem = 580 nm), obtained with a Typhoon 9400 imaging system. Right panel: visible light image of the same gel after staining with Coomassie Blue R-250. Relative molecular weights (kDa) of protein standards are indicated in the margin.
