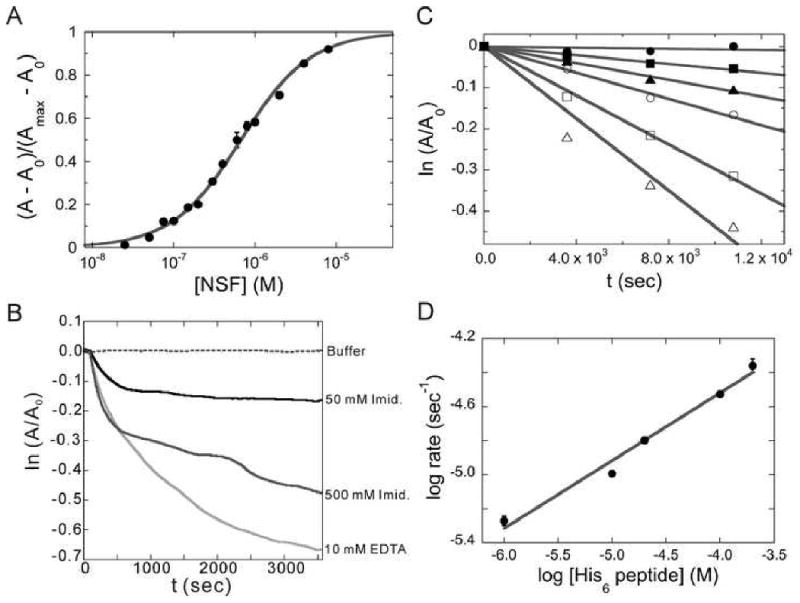
Figure 2. Equilibria and kinetics of (Ni2+-NTA)2-Cy3 interaction with His6-proteins.

(A) Titration of 50 nM (Ni2+-NTA)2-Cy3 with increasing His6-NSF detected by fluorescence anisotropy. Reactions were carried out in (Buffer A + 0.5 mM ADP) at 10°C. The smooth curve is a fit of Equation 4 to the data. (B) Dissociation kinetics of the (Ni2+-NTA)2-Cy3-His6-NSF, monitored by fluorescence anisotropy. Reactions were carried out under the same conditions as (A) with the indicated concentration of EDTA or imidazole. (C) Kinetics of dye exchange between His6 groups. (Ni2+-NTA)2-Cy3-His6-NSF was incubated with 0-200 μM His6-peptide and fluorescence anisotropy was measured as a function of time. Concentrations of His6-peptide were 0μM (●), 1μM (■), 10μM (▲), 20μM (○), 100μM (□) and 200μM (△). The lines are linear fits to the data. (D) The dependence of log (initial rate) on log [His6-peptide] for dye exchange between His6 groups. The line is a linear fit of the data from panel C with a slope of 0.40 ± 0.03.
