
Figure 4. Detection of protein in the presence of DNA at sedimentation equilibrium.
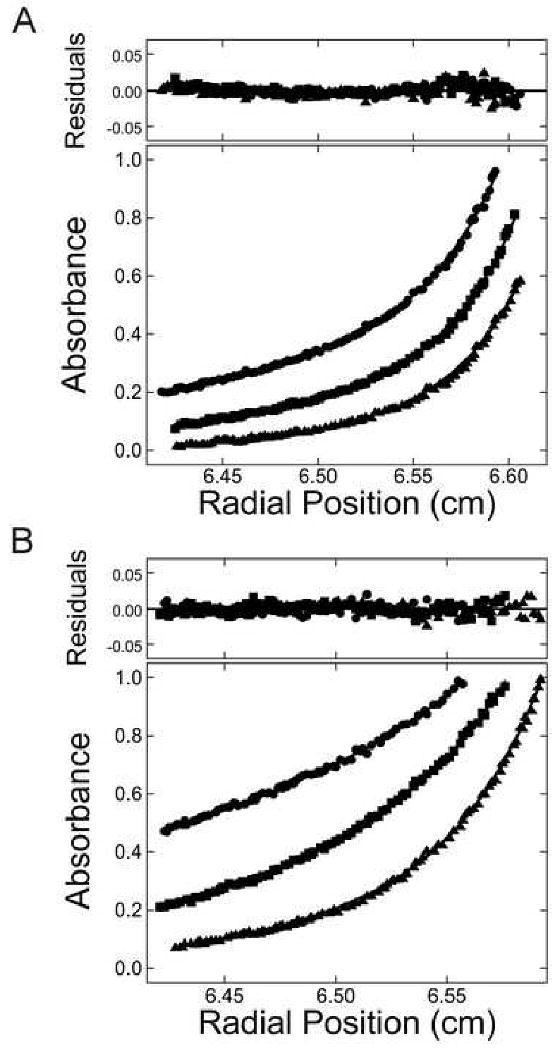
Sedimentation equilibrium data for solutions containing AGT and 26 nt DNA, taken at 4 ± 0.1 °C. (A) Data taken at 260 nm. (B) Data taken at 550 nm. Samples contained DNA (5 × 10⁻⁷ M) and AGT (1.45 × 10⁻⁵ M) in Buffer B. Radial scans acquired at 15,000 (▲), 22,500 (■), and 30,000 (●) rpm are shown. The smooth curves correspond to fits of Equation 3 to each data set. (For the 550 nm data (B), the term for free DNA in Equation 3 was set to zero.) The small residuals, symmetrically distributed about zero (upper panel), indicate that the cooperative nP + D ⇆ PnD model is consistent with the observed mass distributions in these samples.