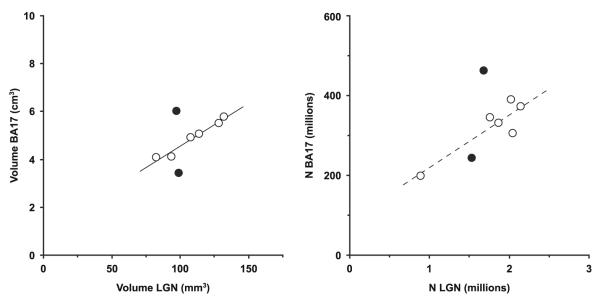
Fig. 10.
Correlation plots for volume and total neuron number of the left LGN versus the left BA17 for the eight subjects included in both this study and our previous study of BA17 [30]. Filled circles indicate comparison subjects and open circles indicate subjects with schizophrenia. Lines are correlation lines for the schizophrenia group (r = 0.982, P = 0.0005, and r = 0.891, P = 0.017, left and right plot, respectively). The broken correlation line at right indicates that the correlation should be interpreted with care as it is predominantly due to the single subject in the lower left of the plot

