
Fig. 5.
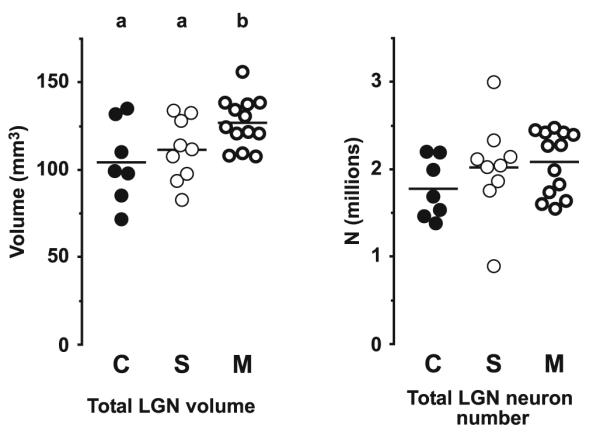
Estimated total volume (left) and neuron number (right) of the left LGN for the comparison (C), schizophrenia (S), and mood disorders (M) groups of subjects. The horizontal bars indicate group means. Lettering at the top indicates significance. Groups not sharing the same letter are significantly different at P<0.05