
Fig. 8.
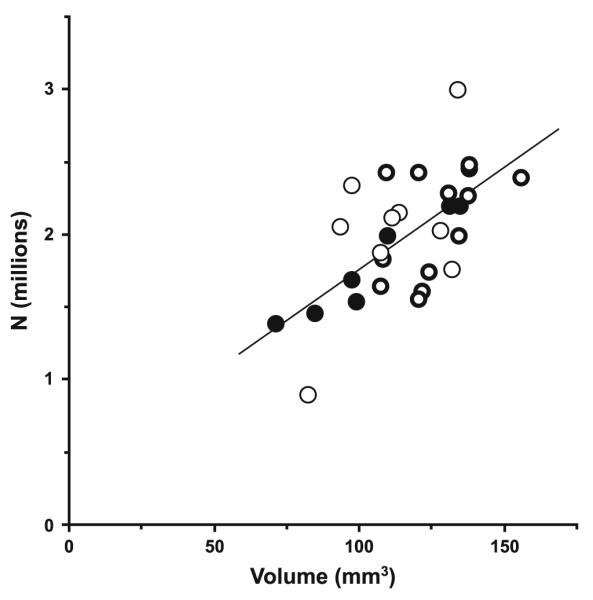
Scatterplot demonstrating the positive correlation (r = 0.64, P = 0.0002) between total neuron number and volume of LGN. Filled circles indicate subjects from the comparison group, thin circles represent subjects from the schizophrenia group, and bold circles symbolize subjects from the mood disorder group. Line is the regression line