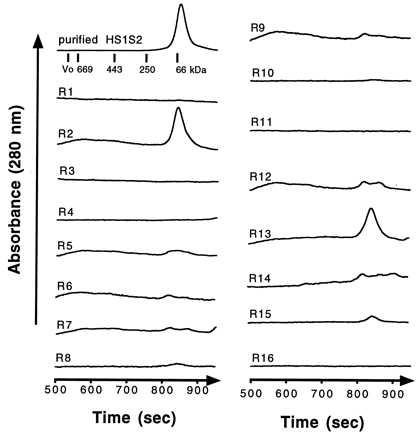
Figure 3.

SEC traces for folded HS1S2 (upper left) and for the supernatant isolated from the 16 fractional factorial folding experiments. The numbers beside each trace correspond to the experiment numbers in Table 1. For all of the 16 runs, the detector sensitivity was the same and was not corrected for the 10-fold lower initial protein concentration in the 0.1 mg/ml folding experiments. The elution profile of protein standards is illustrated in the upper left corner.
