
Figure 4.
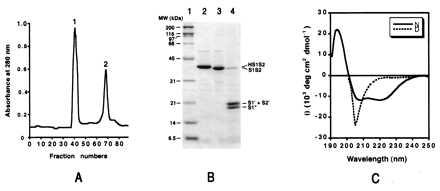
Characterization of HS1S2. (A) SEC of HS1S2, after folding, run on a Superose 12 column. Peak 1 corresponds to high molecular mass aggregates (>300 kDa), and peak 2 corresponds to the elution position of a ∼40-kDa species, i.e., the HS1S2 monomer. (B) Analysis by SDS/PAGE of HS1S2 (lane 2), HS1S2 treated with thrombin (lane 3), and HS1S2 incubated with trypsin (lane 4). Molecular weight markers are in lane 1. (C) CD spectra of HS1S2 under denaturing (D) and native (N) solution conditions.