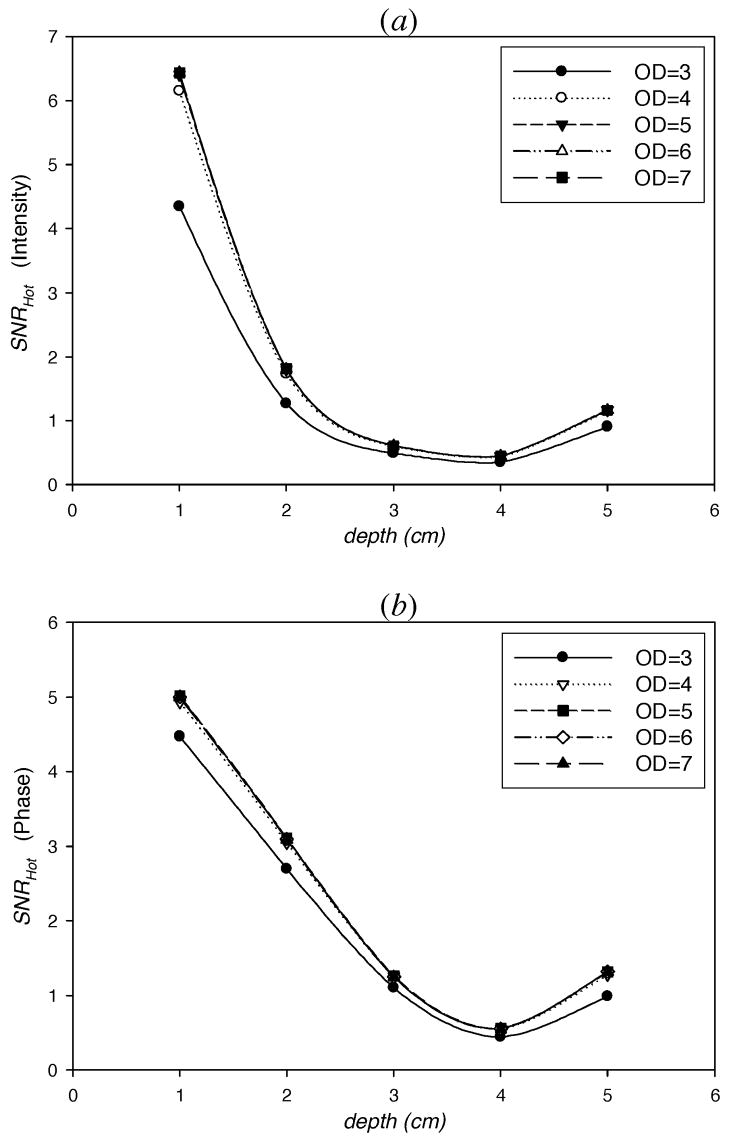
Fig. 8.
SNRHot computed from simulated measurements of (a) intensity, IAC, and (b) phase, θ, in one hundred percent lumpy backgrounds of endogenous as well as exogenous optical properties vs. the depth of 1 cm3 spherical target contrasted from its surroundings by 10:1. The centroid of the target lies in the z-axis and the target depth is measured as the distance from its centroid to the point (0, 0, 5) in breast geometry (Fig. 1). The various plots show the affect of varying optical densities (OD) of the excitation light rejection filter.

