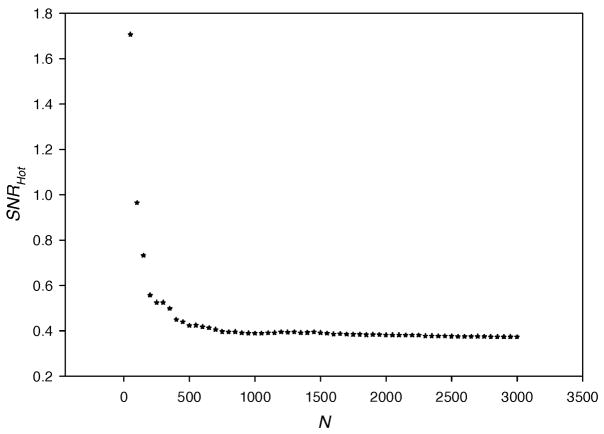
Fig. 9.
SNRHot computed from simulated measurements of intensity, IAC, in one hundred percent lumpy backgrounds of endogenous as well as exogenous optical properties vs. the number of imaging data sets, N. The centroid of the target lies in the z-axis and it is contrasted from its surroundings by 10:1. One twenty eight point detectors (as shown in Fig. 2) are used for the collection of light and only one source is lighted such that the measurement data set is a vector of 128×1.

