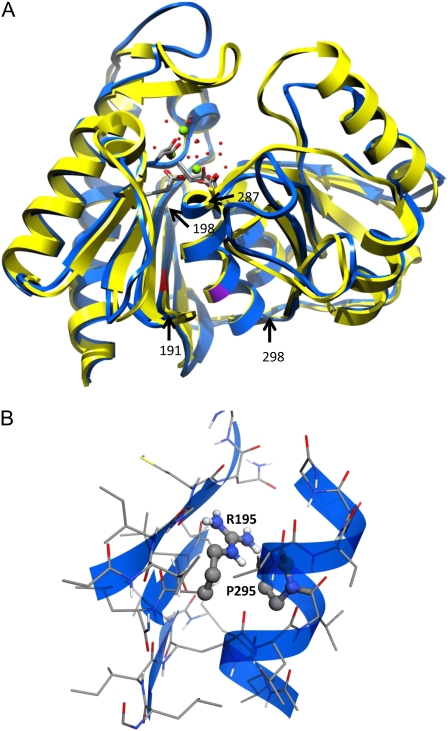
Figure 3.
Homology modeling of IMPL2. A, Superposition of the homology model of IMPL2 (blue) and inositol-1(or 4)-monophosphatase (A-chain) from B. taurus (2bji; yellow). The location of Gly-195 is indicated in red and that of Pro-295 in purple. The active site carboxylates, Mg2+ ions (green spheres), and closely associated water molecules (red spheres) are also shown. The β -sheet at residues 191 to 198 and α -helix from 287 to 298 are indicated by black arrows. Residues 1 to 60 comprising the plastid transit peptide of IMPL2 were not included in the model. B, Close-up view of the best packing around Arg-195 achieved by SCWRL4. The two residues with the greatest overlap (Arg-195 and Pro-295) are represented as ball and stick models.

