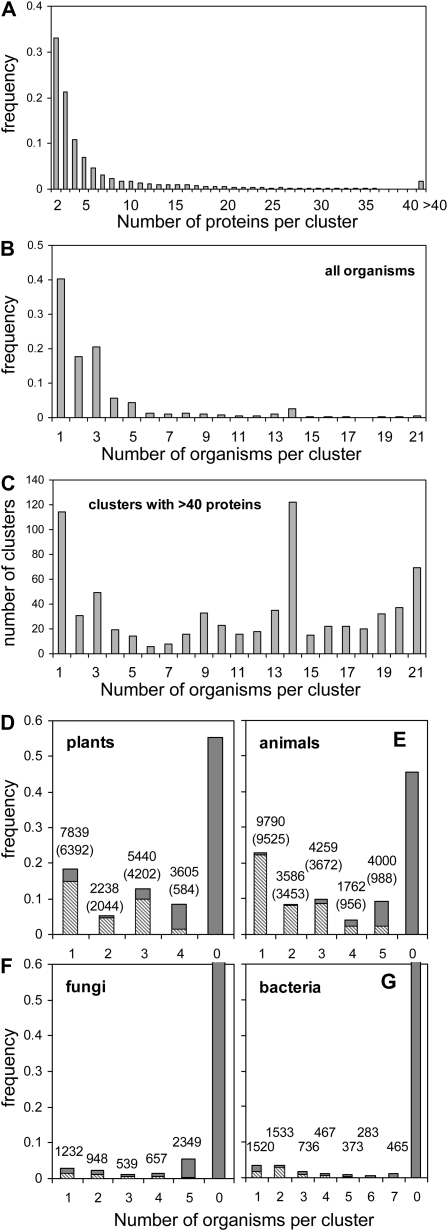
Figure 2.
OMCL clustering of 367,643 proteins from 21 organisms resolved 42,830 clusters/protein families. A, Cluster size frequency. B, Frequency of number of organisms per cluster. C, Distribution of clusters with more than 40 genes across organisms. D to G, Frequency of organisms per cluster in individual kingdoms. The 0 bar indicates clusters not identified in the kingdom. Values above bars are numbers of protein clusters. Lighter gray regions indicate frequency of clusters limited to kingdom, with numerical values in parentheses.

