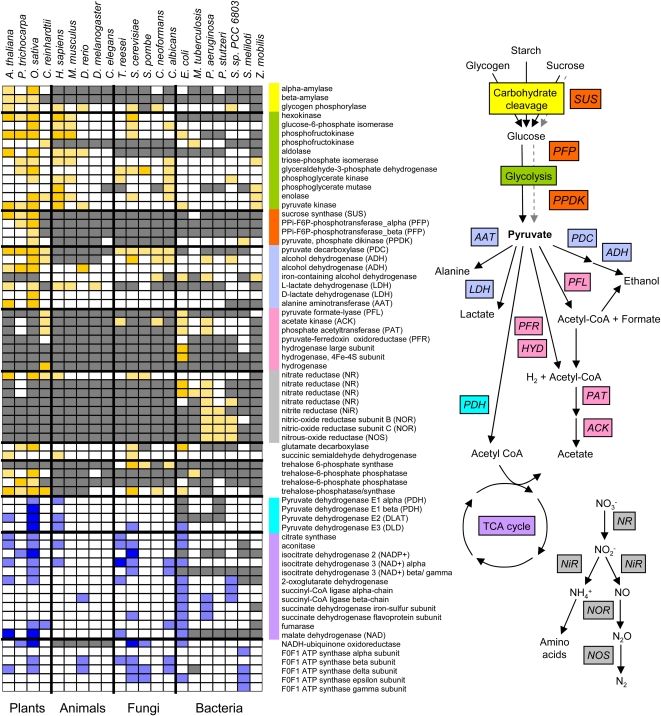
Figure 3.
OMCL clusters of genes encoding proteins involved in glycolysis, fermentation, and the TCA cycle. Colors of bars correspond to proteins in the metabolic pathway at right. A single gene can be represented by multiple OMCL groups because of multisubunit enzyme complexes or large evolutionary differences in genes encoding the protein. Bright yellow, cluster has more than one induced DEG in that organism; light yellow, cluster has one induced DEG in that organism; bright blue, cluster includes more than one reduced DEG in that organism; light blue, cluster includes one reduced DEG in that organism; white, no DEG ortholog identified in that organism; gray, orthologous cluster/protein not identified in that organism. Extended data are shown in Supplemental Figure S4.

