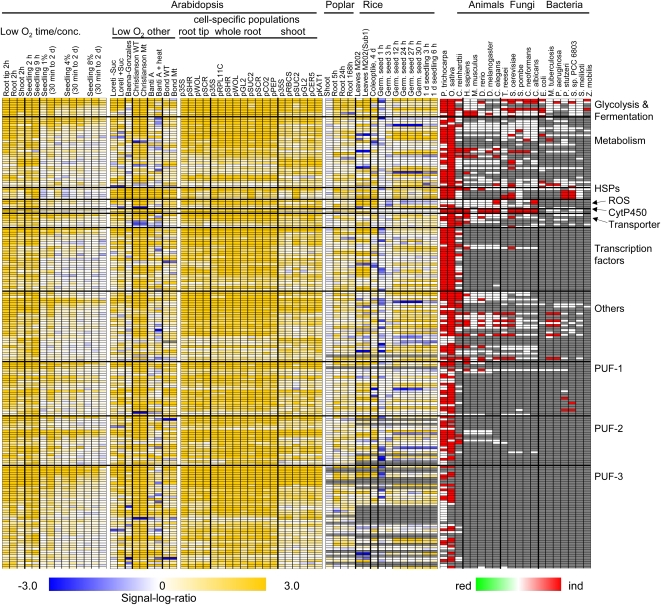
Figure 4.
Low-oxygen-induced genes of Arabidopsis: expression across experiments, cell types, and orthologs in other organisms. The top 200 induced DEGs were selected from Supplemental Table S9. Each row represents one gene. Genes were manually grouped into functional categories. Left, Signal-log ratio values for genes across different plant experiments (Arabidopsis experiments, Loreti et al., 2005; Baena-González et al., 2007; Branco-Price et al., 2008; Bond et al., 2009; Christianson et al., 2009; Mustroph et al., 2009; van Dongen et al., 2009; Banti et al., 2010; Arabidopsis cell-specific populations, Mustroph et al., 2009, root tip, whole root, whole shoot; poplar experiments, Kreuzwieser et al., 2009; rice experiments, Lasanthi-Kudahettige et al., 2007; Narsai et al., 2009; this study). Poplar and rice orthologs were identified by selecting the most highly expressed probe set either belonging to the same OMCL group as the Arabidopsis proteins or having a BLASTP similarity E value of 10−6 or less. conc., Concentration. Right, Orthologs in different organisms from plants (P. trichocarpa, O. sativa, Chlamydomonas), animals (H. sapiens, M. musculus, D. rerio, D. melanogaster, C. elegans), fungi (T. reesei, S. cerevisiae, S. pombe, C. neoformans, C. albicans), and bacteria (E. coli, M. tuberculosis, P. aeruginosa, P. stutzeri, S. meliloti, Synechocystis species PCC 6803, Z. mobilis). Orthologs were identified by a BLASTP similarity cutoff of E ≤ 10−6. Red, induced orthologs present in that organism; white, ortholog(s) not DEG(s); gray, no ortholog in that organism.

