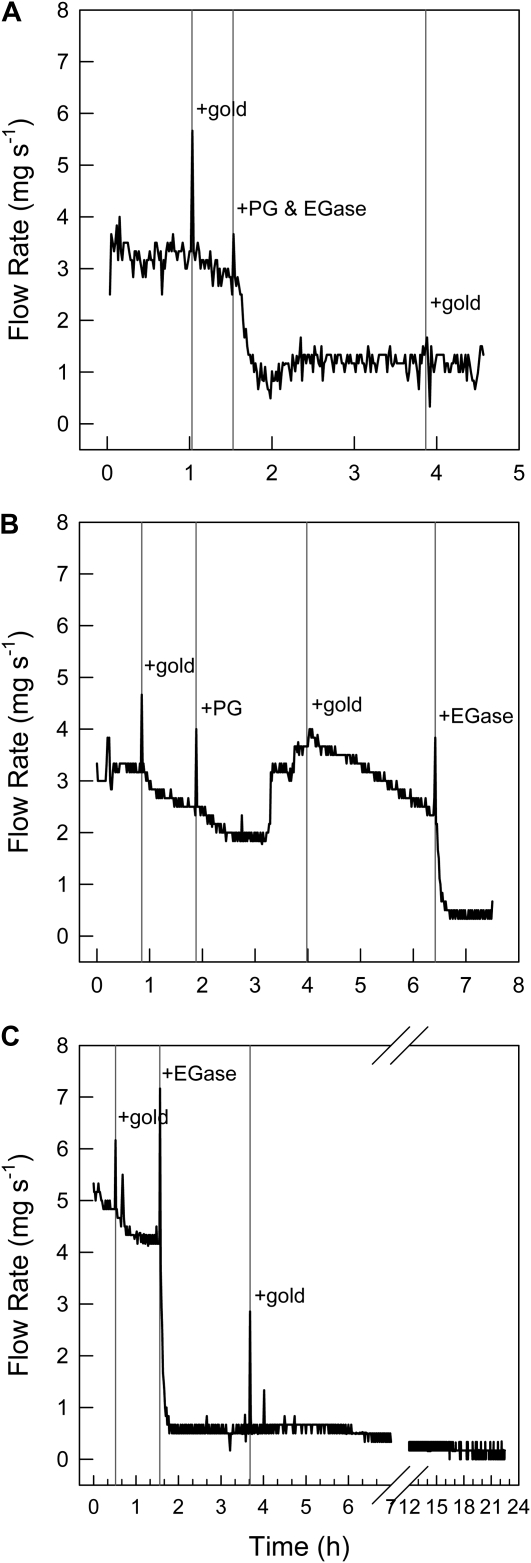
Figure 3.
Water flow rates over the course of several perfusion experiments. The plotted rates correspond to the average of four data points per minute. The vertical lines show the times of introduction of colloidal gold and enzymes. The presence of gold particles in the eluting fluid was assayed in the collected fractions throughout the experiments (see Fig. 2). A, Example of a gold and enzyme infiltration experiment. Gold particles added the first time were detected in the eluent only after PG + EGase had also been introduced into the stem, whereas the second pulse of colloidal gold was detected immediately after its introduction. Sharp rises or drops in flow rate between consecutive treatments reflect temporary pressure changes associated with switching between solutions. B, Example of an experiment in which gold particles, PG, and EGase were injected sequentially into the stem. C, Example of an experiment in which gold particles and EGase alone were infiltrated into the stem. In B and C, gold particles were not detected after the introduction of PG or EGase alone.

