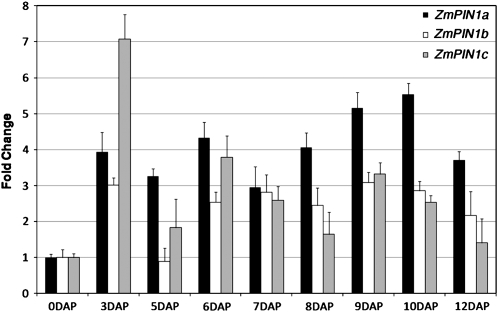
Figure 1.
ZmPIN1 quantitative expression analysis. Quantitative real-time PCR analysis reveals that ZmPIN1 genes show differential expression patterns during kernel development. All three genes are up-regulated after double fertilization of the maize embryo sac: ZmPIN1c shows an increase in expression levels (7-fold increase) in 3-DAP kernels, while ZmPIN1a expression increases during later stages. The average value from three replicates and two biological samples was estimated for the three ZmPIN1 mRNAs. This value was subsequently normalized by applying the Pfaffl (2001) method to the transcript level of the housekeeping genes 18S and GAPC2, in order to avoid differences in the RNA extraction and cDNA synthesis. Bar diagrams show standardized average levels of ZmPIN1 transcripts, expressed as fold change with respect to the mRNA levels measured in ovaries from unfertilized ears. sd bars are indicated.

