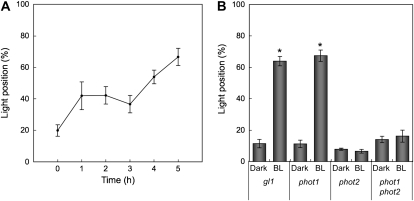
Figure 2.
Quantification of nuclear positioning in epidermal cells. A, Time course of light-dependent nuclear positioning. After the 16-h dark treatment, leaves of the wild-type plants were continuously irradiated with blue light at 100 μ mol m−2 s−1 up to 5 h. The abscissa shows the irradiation time. The ordinate shows the percentage of cells having nuclei located along anticlinal walls. Each plot shows the mean ± se. On average, 150 cells were observed in each of four to five leaves from different plants. B, Nuclear positioning in phototropin mutants. After dark treatment for 16 h (Dark), leaves of the gl1 and phototropin mutants (phot1, phot2, and phot1phot2) were continuously irradiated with blue light at 100 μ mol m−2 s−1 for 5 h (BL). The ordinate shows the percentage of cells having nuclei located along anticlinal walls. Each plot shows the mean ± se. On average, 70 cells were observed in each of five leaves from different plants. An asterisk means that a significant difference was detected between Dark and BL in each type of plant (P < 0.05 with Student's t test).

