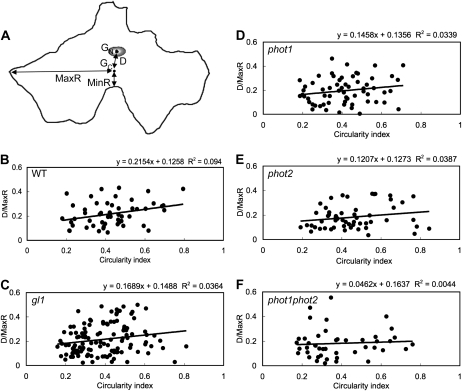
Figure 3.
Relationship between nuclear position and cell shape in epidermal cells in darkness. A, Representative epidermal cell. Positional parameters were defined as follows: GN and GC, the centers of the nucleus and the cell; D, the distance between GN and GC; and MinR and MaxR, the shortest and longest distances from the GC to anticlinal wall. B to F, Scatter plot analysis of circularity index versus D/MaxR. Circularity index (abscissa) and D/MaxR (ordinate) were calculated for dark-adapted epidermal cells of the wild type (WT; B), gl1 (C), phot1 (D), phot2 (E), and phot1phot2 (F). The solid line shows linear regression line.

