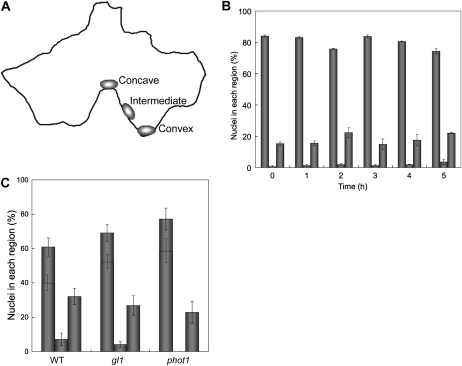
Figure 4.
Nuclear position in epidermal cells under light treatment. A, Illustration of nuclear position in an epidermal cell, showing the regions of the anticlinal wall classified as concave, intermediate, and convex. B, Extent of nuclei located at the concave region over time. After the 16-h dark treatment, leaves of wild-type plants were continuously irradiated with blue light at 100 μ mol m−2 s−1 up to 5 h. The abscissa shows the irradiation time. The ordinate shows the percentage of nuclei at the anticlinal wall located in concave (left columns), convex (center columns), and intermediate regions (right columns). Each plot shows the mean ± se. On average, 150 cells were observed in each of four to five leaves from different plants. C, Extent of nuclei located at the concave region nearest GC. After the 16-h dark treatment, leaves of the wild type (WT), gl1, and phot1 were continuously irradiated with blue light for 5 h. The ordinate shows the percentage of nuclei at the anticlinal wall located in concave (left columns), convex (center columns), and intermediate regions (right columns). The percentage of cells having nuclei located at the concave region nearest GC is shown in each of the left-hand columns. Each plot shows the mean ± se. On average, 12 cells were observed in each of five leaves from different plants.

