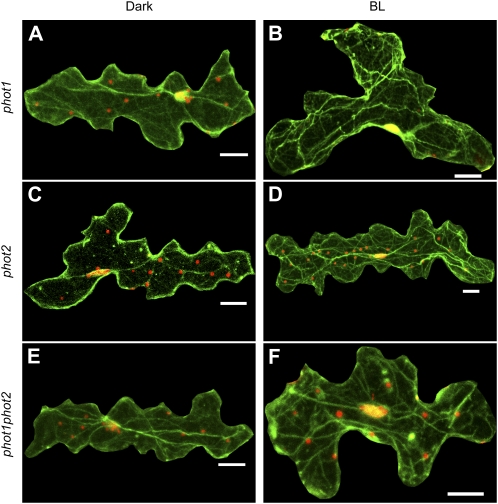
Figure 7.
Organization of actin filaments in the epidermal cells of phototropin mutants under dark and light treatments. Confocal fluorescence micrographs of leaves of phot1 (A and B), phot2 (C and D), and phot1phot2 (E and F) at the end of the 16-h dark treatment (Dark) or after a 5-h continuous irradiation with blue light at 100 μ mol m−2 s−1 (BL). Nuclei (red) and actin filaments (green) were imaged as in Figure 6, C to G. Bars = 20 μ m.

