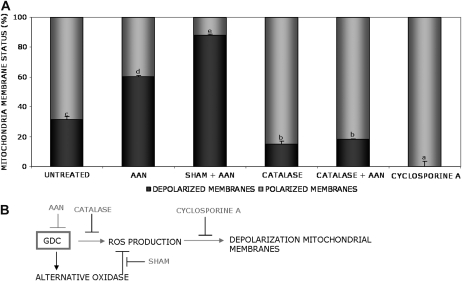
Figure 9.
AAN-induced depolarization of mitochondrial membranes. AAN was used to study the effect of GDC inhibition in Arabidopsis. A, One-week-old cultured Arabidopsis cells were treated for 30 min with different inhibitors on the 96-well plate in the grow chamber. Afterward, JC-1 dye (5 μ g mL−1), to probe the mitochondrial membrane potential, and 10 mm AAN were added and the measurement was started. The mitochondrial depolarization was indicated by a decrease in the red-green fluorescence intensity ratio. The data represent the status of the mitochondrial membrane 30 min after AAN treatment. Black bars indicate the percentage of depolarization. SHAM, 2 mm; catalase, 100 units mL−1; cyclosporine A, 50 μm. Cyclosporine A was used as a control for complete polarization (100%). The experiment was repeated three times with similar results. Different letters indicate values statistically different based on a one-way ANOVA followed by Tukey's honestly significant difference posthoc test (F = 532.6, df = 7, P < 0.01). B, Model proposed to explain the relation between GDC and AOX in modulating depolarization mitochondrial membranes.

