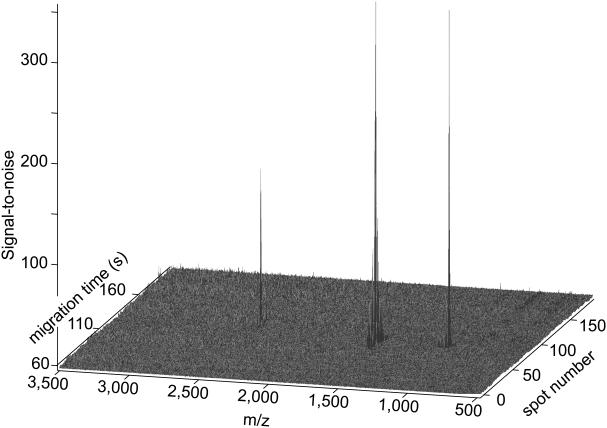
Figure 2.
Signal-to-noise plot of data generated from three standard peptides. The spot number is given on the right and the migration time on the left. Amplitude is equal to the signal-to-noise ratio, where noise was defined as the standard deviation of the signal over the first 50 spots. Spot deposition began 60 seconds after the start of the electrophoretic separation

