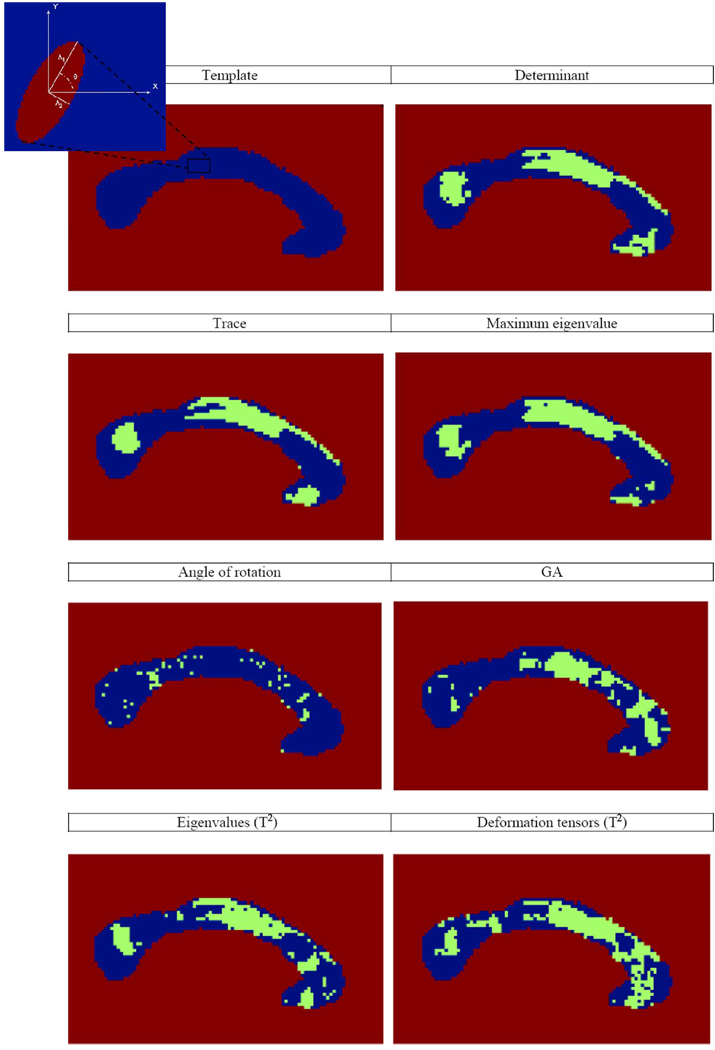
Fig. 2.
Green regions indicate p-values for which p < 0.05. From left to right and top to bottom. The template corpus callosum. The corner figure is an illustration of a deformation tensor at one voxel. The axes of the ellipse point in the directions of the eigenvectors, and their lengths represent the size of the associated eigenvalues. Scalar t-tests for group differences (AIDS versus controls) for various alternative measures of shape differences: the determinant (λ1 λ2) of the deformation tensor (pFDR = 0.018), trace (λ 1 + λ2) (pFDR = 0.028), maximum eigenvalue (λ1) (pFDR = 0.019), angle of rotation (θ) of the eigenvectors (pFDR = 0.44), and the geodesic anisotropy (pFDR = 0.034). Also shown are maps constructed from the multivariate Hotellings T2 tests: on the vector composed of the two eigenvalues (λ1, λ2) (pFDR = 0.016), and on the log of the deformation tensors (pFDR = 0.010). The shape alterations in the genu (the most anterior part) of the corpus callosum are not detected unless a multivariate test is used. Even areas with more subtle fiber degeneration are identified with the multivariate statistics on the full tensor.

