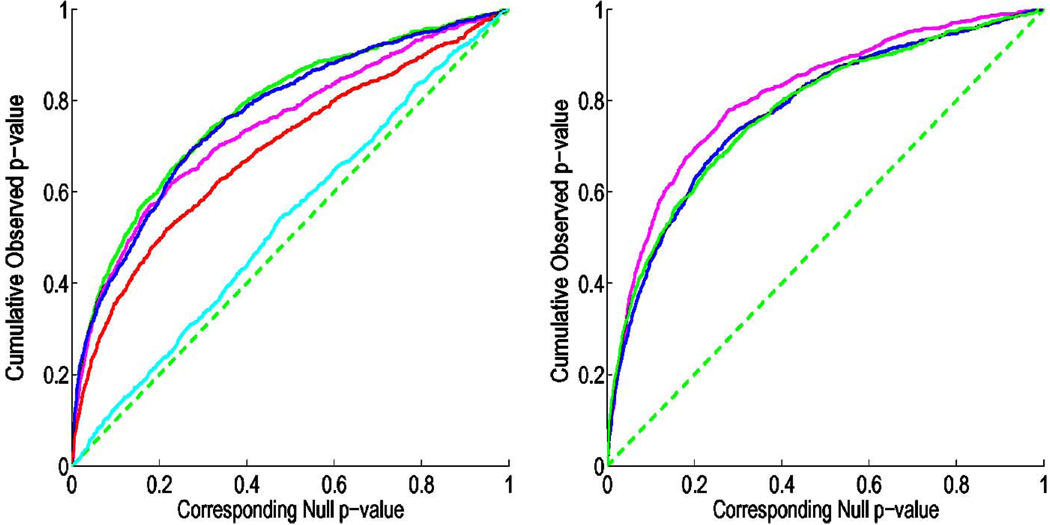
Fig. 3.
This figure shows the cumulative distribution of p-values versus the corresponding cumulative p-value that would be expected from a null distribution for a) the various scalar statistics: trace (magenta), geodesic anisotropy (red), angle (cyan), maximum eigenvalue (blue), and the determinant (green). b) the determinant (green), the eigenvalues (blue) and the log of the deformation tensor (magenta). In FDR methods, any cumulative distribution plot that rises steeply is a sign of a significant signal being detected, with curves that rise faster denoting higher effect sizes. This steep rise of the cumulative plot relative to p-values that would be expected by chance can be used to compare the detection sensitivity of different statistics derived from the same data.

