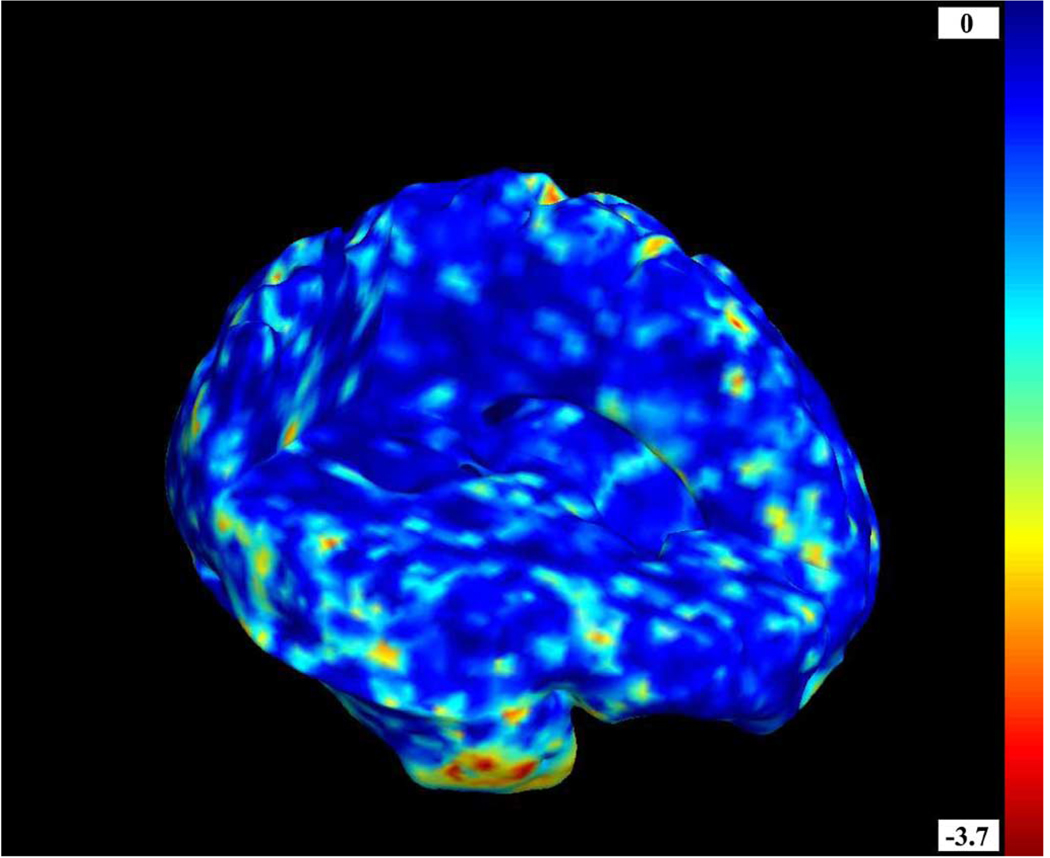
Fig. 7.
P-values are shown on a log10 scale from a permutation distribution assembled by comparing two groups of subjects who do not differ in diagnosis. Two subsets of 13 randomly selected patients and six randomly selected controls were compared, i.e., the sample was split in half and assigned to two groups randomly, while ensuring each group had equal numbers of patients and controls. As expected, no significant morphometric difference is detected. In any null random field, on average a proportion t of the voxels will have p-values lower than any fixed threshold t in the range zero to one. This accounts for the appearance of low p- values in some brain regions (e.g., the right temporal pole, shown here in red and yellow colors).

