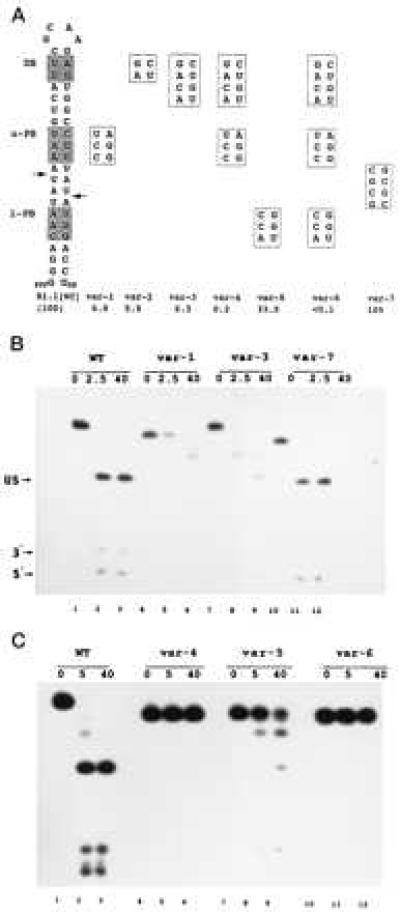
Figure 2.

Bp-sequence-dependent inhibition of substrate cleavage. (A) Structure of R1.1[WC] RNA and the relevant sequences of seven variants. Cleavage of R1.1[WC] RNA occurs at the two indicated sites (arrows), determined by oligonucleotide sequence analysis of cleavage products (not shown). DB, distal box; u-PB, upper proximal box; l-PB, lower proximal box. Numbers given below the R1.1[WC] variants are cleavage rates relative to the R1.1[WC] RNA rate (100%, or ≈150 fmol product/min). The reported values are the average of at least three experiments, with standard deviations ≤13%. (B) Cleavage time course pattern for internally 32P-labeled R1.1[WC] RNA (WT, lanes 1–3) and variant 1 (lanes 4–6), variant 3 (lanes 7–9), and variant 7 (lanes 10–12). Time points (minutes) are indicated. (C) Same as experiment in B, but examining variant 4 (lanes 4–6), variant 5 (lanes 7–9), and variant 6 (lanes 10–12). Lanes 1–3 are for R1.1[WC] RNA. The cleavage products are the upper stem (US, 28 nucleotides); a 5′-end-containing fragment (5′, 10 nucleotides), and a 3′-end-containing fragment (3′, 8 nucleotides). The slighter slower rate of cleavage for R1.1[WC] RNA in the experiment in the lower panel reflects typical variation from experiment to experiment. The differing gel mobilities of the uncleaved RNAs reflect conformational differences in 7M urea, also seen elsewhere (23). For several of the variants, the two species with mobilities between the substrate and the 28-nt upper stem product represent products of single-site cleavage.
