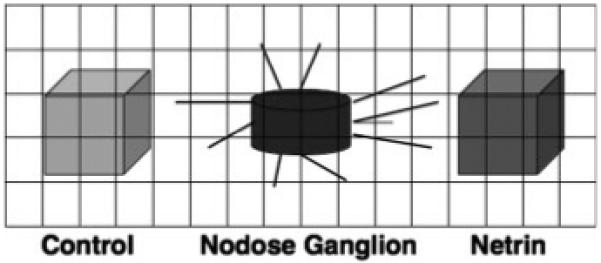
Figure 1.

Schematic representation of an explanted nodose ganglion with aggregates of netrin-1-secreting (Netrin) and control (Control) 293-EBNA cells arranged on either side, at 180° apart. A sample superimposed grid is illustrated. Neurite density is measured in defined fields by counting the number of grid line intersections covered by neurites, normalized to the total number of intersections.
