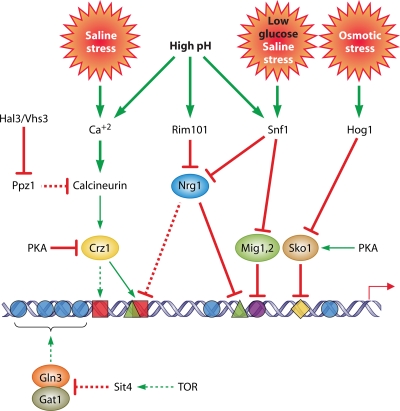
FIG. 4.
Regulation of ENA1 expression by saline and alkaline stress. Symbols denote known or predicted regulatory sites (○, GATA; ▪, CDRE; ▵, NRG; •, MIG; ⧫, CRE). The promoter is not drawn to scale, but the relative positions of the regulatory sites are maintained. Discontinuous lines denote regulatory interactions still to be fully documented. See the text for details. (Adapted from reference 247a.)

