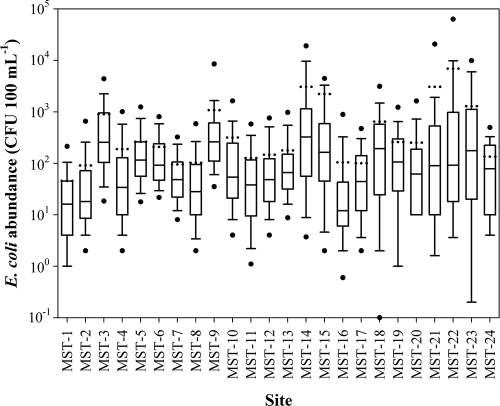
FIG. 1.
Box plots of E. coli counts (CFU 100 ml−1) in surface waters for each of the 24 sites of the South Nation River watershed. A box and whiskers represent the first and third quartiles (bottom and top lines of the box), the median (middle line of the box), and the smallest and largest observations (bottom and top whiskers) of a data distribution. Dots below and above the whiskers represent the 5th and 95th percentiles, respectively.

