FIG. 3.
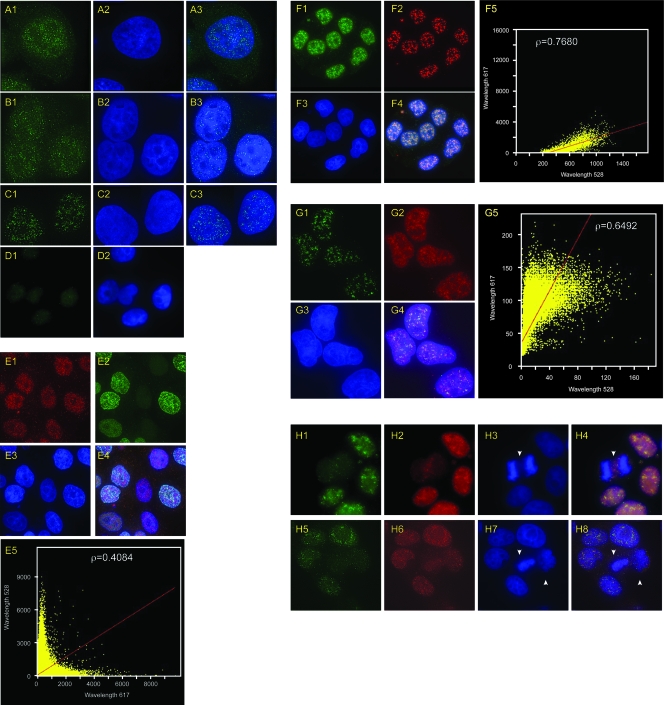
Indirect immunofluorescence localization of DUE-B. (A) HeLa cells stained with anti-DUE-B antibody (A1) and DAPI (A2) (merged image [A3]). (B) HeLa A1 cells expressing epitope (His6)-tagged DUE-B stained with anti-His6 antibody (B1) and DAPI (B2) (merged image [B3]). (C) Staining done as in panel B, with 0.2% Triton X-100 preextraction. (D) Negative-control HeLa cells stained with anti-His6 antibody (D1) and DAPI (D2). (E) HeLa A1 cells pulse-labeled with BrUdR and stained with anti-His6 antibody (E1), anti-BrUdR antibody (E2), and DAPI (E3) (merged image [E4]). (E5) Plot showing degree of colocalization of DUE-B (λ = 617 nm) and BrUdR (λ = 528 nm) signals (Pearson correlation coefficient, ρ = 0.4084). (F) HeLa A1 cells stained with anti-His6 antibody (F1), anti-SAP145 antibody (F2), and DAPI (F3) (merged image [F4]). (F5) Plot showing degree of colocalization of DUE-B (λ = 528 nm) and SAP145 (λ = 617 nm) signals (Pearson correlation coefficient, ρ = 0.7680). (G) HeLa A1 cells stained with anti-His6 antibody (G1), anti-SM antibody (G2), and DAPI (G3) (merged image [G4]). (G5) Plot showing degree of colocalization of DUE-B (λ = 528 nm) and Sm (λ = 617 nm) signals (Pearson correlation coefficient, ρ = 0.6492). (H) HeLa A1 cells stained with anti-His6 antibody (H1, H5), anti-SAP145 antibody (H2, H6), and DAPI (H3, H7) (merged images [H4, H8]). Arrowheads indicate cells in mitosis.

