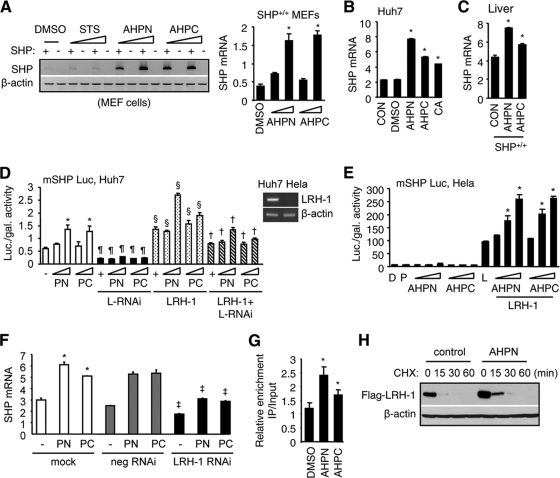
FIG. 3.
AHPN and 3-Cl-AHPC activate SHP gene expression via LRH-1. (A) Semiquantitative (left) and real-time PCR (right) analyses of SHP mRNAs in SHP+/+ and SHP−/− MEFs treated with AHPN (1 or 10 μM) or 3-Cl-AHPC (10 or 100 μM). Staurosporine (0.1 or 10 μM) showed no effect and thus served as a negative control. (B) Real-time PCR analysis of SHP expression in Huh7 cells. CON, nontreated cells; DMSO, 0.1%; AHPN, 1 μM; 3-Cl-AHPC, 10 μM. Cholic acid (CA) (100 μM) served as a positive control. Data are represented as mean ± SEM (*, P < 0.01). (C) Real-time PCR analysis of hepatic SHP mRNAs in SHP+/+ mice following i.p. administration of AHPN (10 mg/kg/mouse) or 3-Cl-AHPC (10 mg/kg/mouse) for 3 days. Data are represented as mean ± SEM (*, P < 0.01). (D) Transient-transfection assays of mouse SHP (mSHP) promoter luciferase (Luc) reporter in Huh7 cells. Luc activities were determined and normalized to β-galactosidase (gal) activities. PN, AHPN (1 or 10 μM); PC, 3-Cl-AHPC (10 or 100 μM); L-RNAi, LRH-1-RNAi. *, significant difference compared to the group (lane 1) without AHPN and 3-Cl-AHPC treatment (P < 0.01); ¶, significant difference compared to each corresponding group without L-RNAi (white bars); §, significant difference compared to each corresponding group without (white bars) and with (black bars) L-RNAi; †, significant difference compared to each corresponding group with L-RNAi (black bars) and LRH-1 (stippled bars). Top right, reverse transcription-PCR (RT-PCR) analysis of LRH-1 mRNA in Huh7 and HeLa cells. (E) Transient-transfection assays of mouse SHP (mSHP) promoter luciferase (Luc) reporter in HeLa cells. D, DMSO; P, pcDNA3; L, LRH-1. Doses, AHPN, 0.1, 1, and 10 μM; 3-Cl-AHPC, (1, 10, and 100 μM. Data are represented as mean ± SEM (*, P < 0.01 versus L). (F) Real-time PCR analysis of SHP mRNA in Huh7 cells transfected with negative (neg) control or LRH-1 RNAi in the presence of AHPN (PN) and 3-Cl-AHPC (PC). *, significant difference compared to nontreated group; ‡, significant difference compared to each corresponding “mock” group. (G) ChIP assays to determine the enhanced recruitment of LRH-1 to the endogenous hSHP promoter by AHPN (10 μm) and 3-Cl-AHPC (100 μm) in Huh7 cells (*, P < 0.01 versus DMSO). (H) Western blotting to determine the effect of AHPN (1 μm) on LRH-1 protein degradation in the presence of the protein synthesis inhibitor cycloheximide (CHX) (50 μm) in Huh7 cells.

