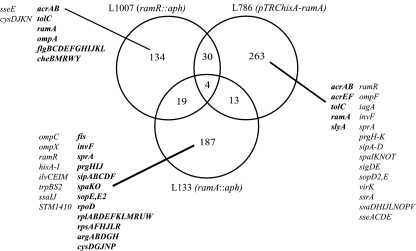
FIG. 1.
Venn diagram of all significant (B > 0) gene expression changes within the comparison of L354 (S. Typhimurium SL1344) against L133 (S. Typhimurium ramA::aph), L1007 (S. Typhimurium ramR::aph), and L786 (S. Typhimurium pTRChisA-ramA). Selected genes from each strain are displayed. Boldface shows increased gene expression; lightface shows decreased gene expression.

