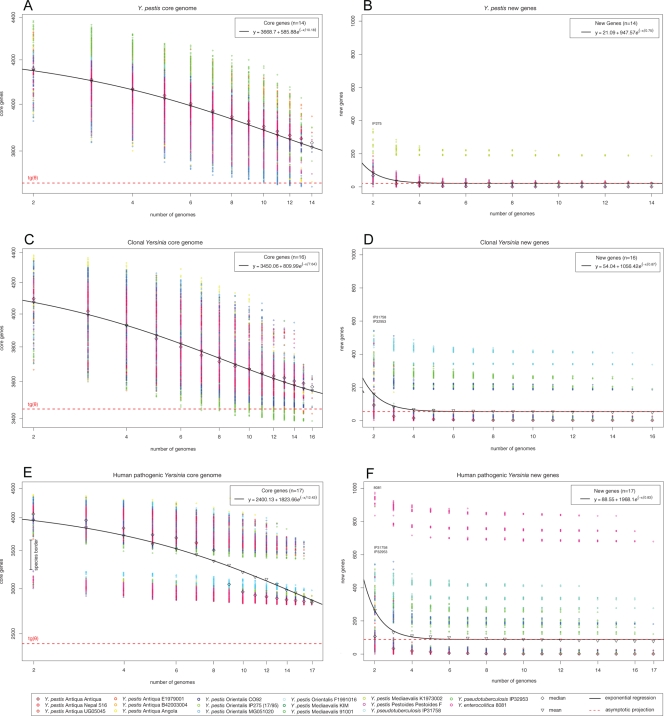
FIG. 5.
Core genes and gene discovery in human pathogenic Yersinia. (A) Core genes. For each number of genomes n, circles are the permutations for Y. pestis values obtained for a sampling size of 1,000. Diamonds and triangles give median and mean values for each distribution. The curve represents the exponential regression of the least-squares fit of Fcore(n) = κc exp[−n/τc] + tgc(θ). The extrapolated core genome size is shown as a horizontal dashed red line. (B) Gene discovery. The numbers of new genes found are plotted for increasing values of n. The curve is the least-squares fit of the exponential decay Fnew(n) = κn exp[−n/τn] + tgn(θ) based on the means of the distribution. The value of tgn(θ) shown represents the number of new genes asymptotically predicted for further genome sequencing. Core genes (C, E) and gene discovery (D, F) when Y. pseudotuberculosis strains IP31758 and IP32953 and Y. enterocolitica 8081 are included.

