
FIG. 5.
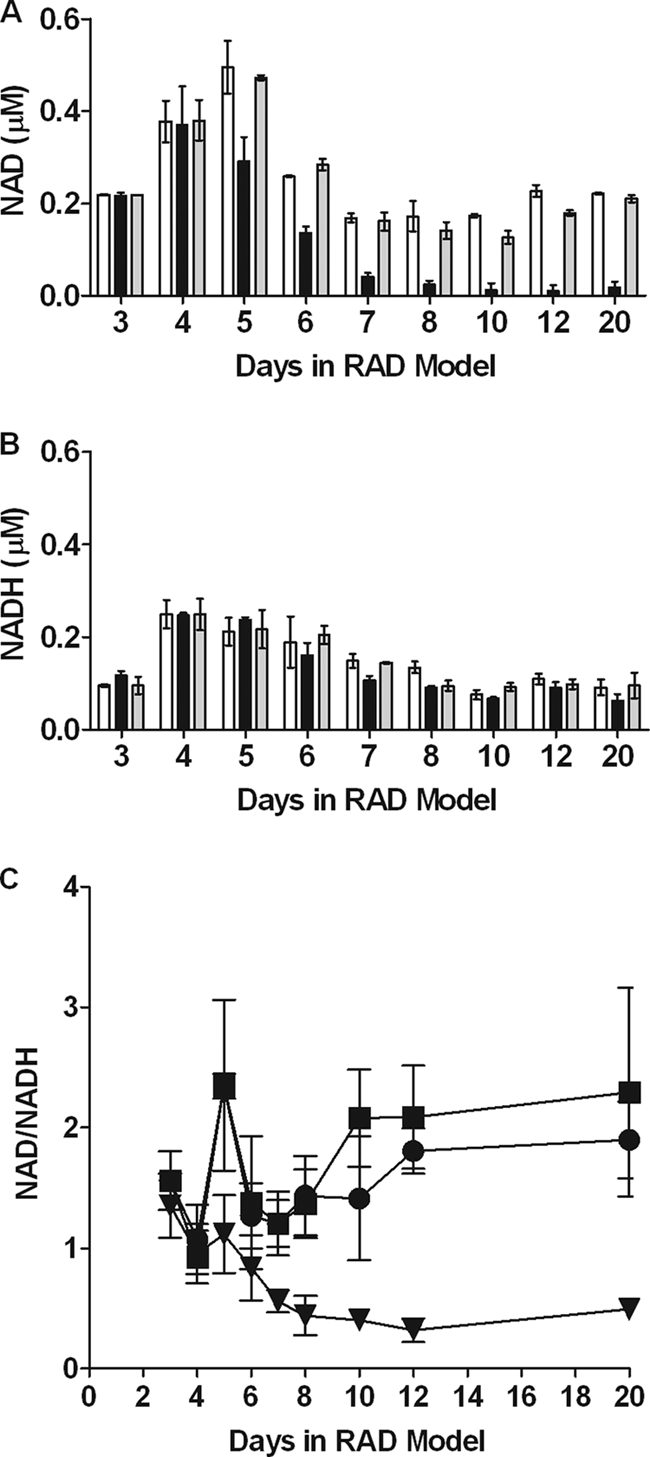
NAD and NADH levels and NAD/NADH ratio during early dormancy. Samples from dormancy model cultures were harvested at various time points in an anaerobic chamber. Nucleotides were extracted using either acid or base combined with heat and frozen prior to measurement using an alcohol dehydrogenase-based NAD-NADH cycling assay. The values are the averages of three experiments. (A and B) Levels of NAD (A) and NADH (B). Open bars, H37Rv; black bars, DorKO; gray bars, DorCO. (C) Ratio of NAD to NADH. Squares, H37Rv; triangles, DorKO; circles, DorCO.