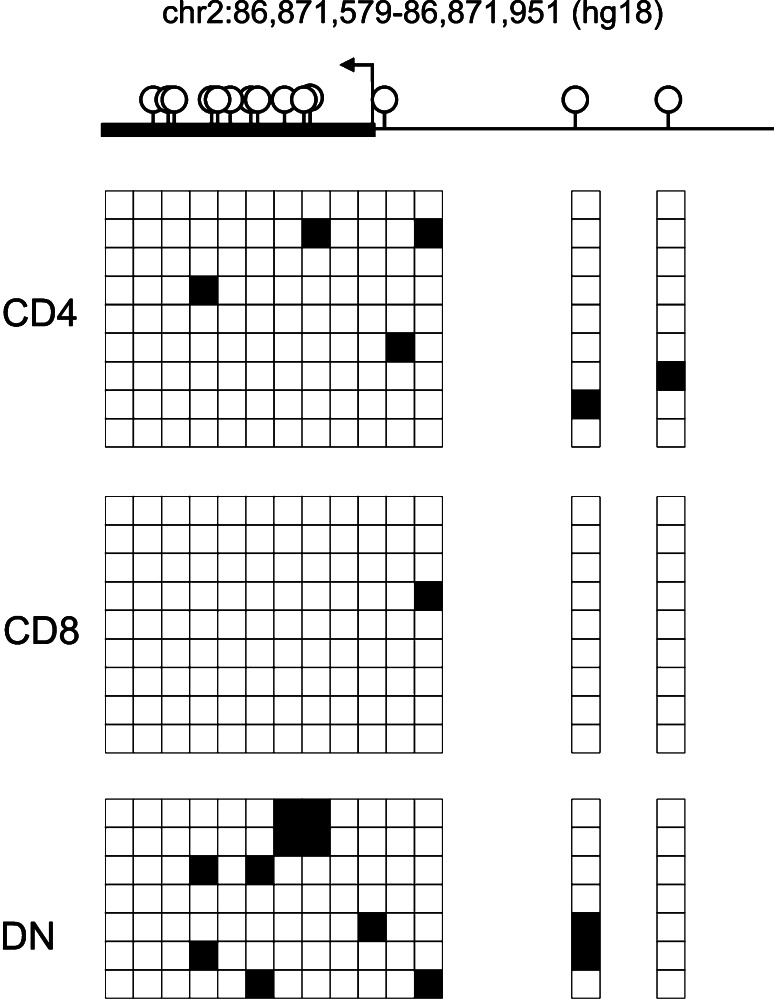
Fig. 3.
CD8 gene demethylation in T4H2 DN T cells. Schematic overview of human CD8α promoter and positions of CpG motifs (upper panel). Genomic DNA from DN T cell clone T4H2, CD8+ T cell clone 3.9 and a CD4+ T cell clone was analyzed by bisulfite sequencing. In the matrix, each row represents one sequenced insert, each box shows methylation status of a single CpG. Filled boxes indicate methylation (lower panel)

