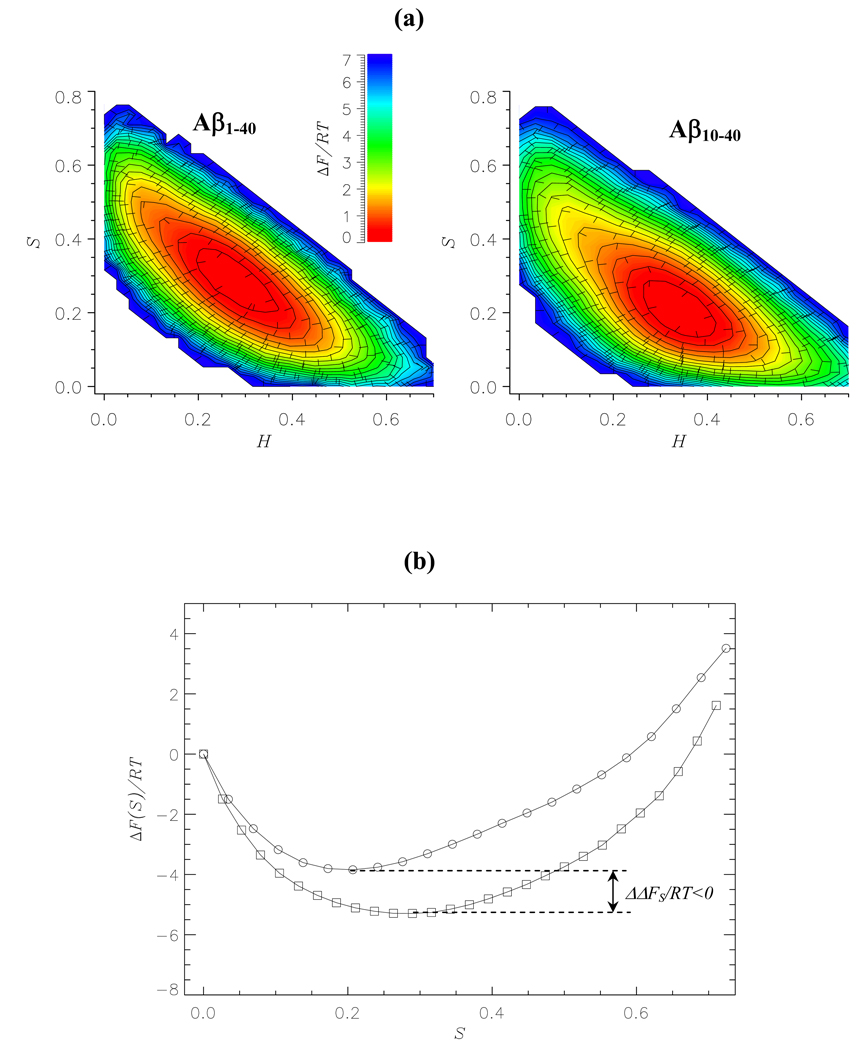
Fig. 6.
(a) Two-dimensional projections of the free energy ΔF(H,S) as a function of the helix and strand fractions, H and S: Aβ1–40 monomer (left panel); Aβ10–40 monomer (right panel). The minima in free energy are set to zero. The values of ΔF(H, S) are color coded according to the scale. (b) One-dimensional profiles of the free energy ΔF(S): Aβ1–40 monomers (squares); Aβ10–40 monomers (circles). The states with zero strand contents are set to have zero free energy. The plots in (a) and (b) demonstrate that β-strand structure is stabilized in Aβ1–40 compared to Aβ10–40. ΔΔFS is the free energy difference between the β-strand states in Aβ1–40 and Aβ10–40. β-strand states are operationally defined to have free energies less than −2RT.

