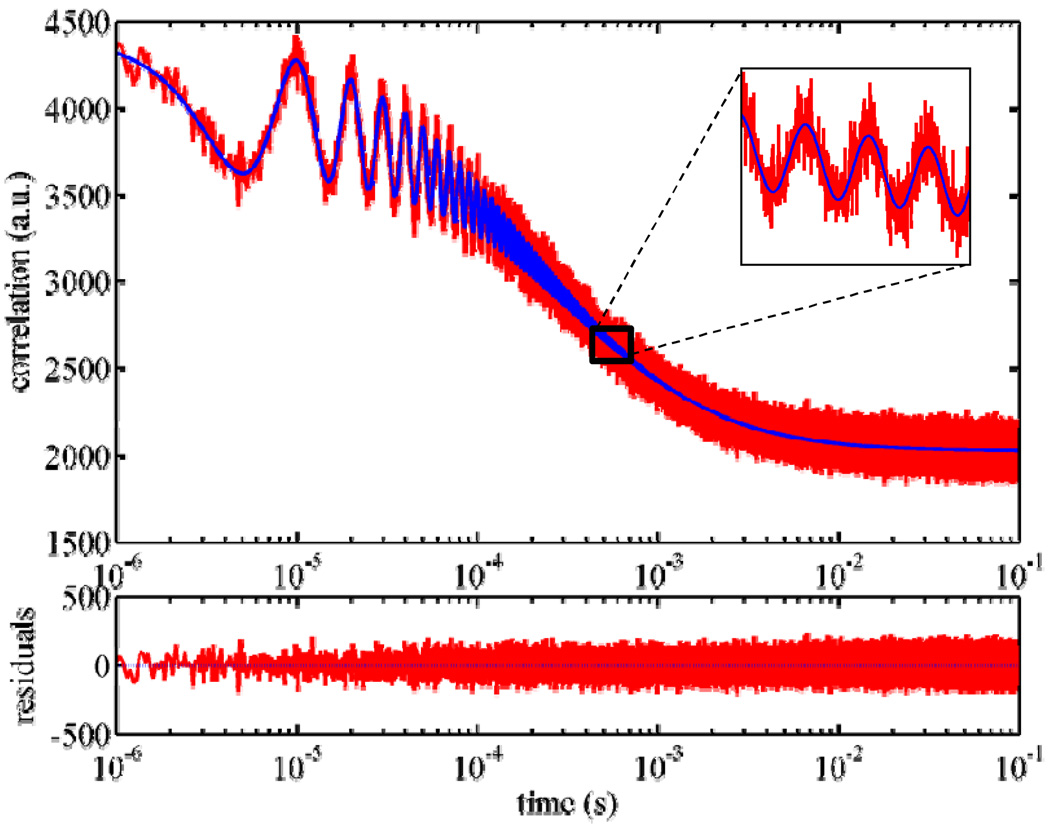
Fig. 2.
pmFCS measurements on an Atto655 maleimide in aqueous solution. (Excitation power: 60µW; measurement time: 30 min). The autocorrelation function shows modulation in amplitude with 10 µs period, which matches the input modulation period of the excitation laser polarization. The solid line shows the fitted curve using Eq. (7). Inset shows the zoom-in of a small portion of the curve and fit. The bottom panel shows the residual of the fitting.

