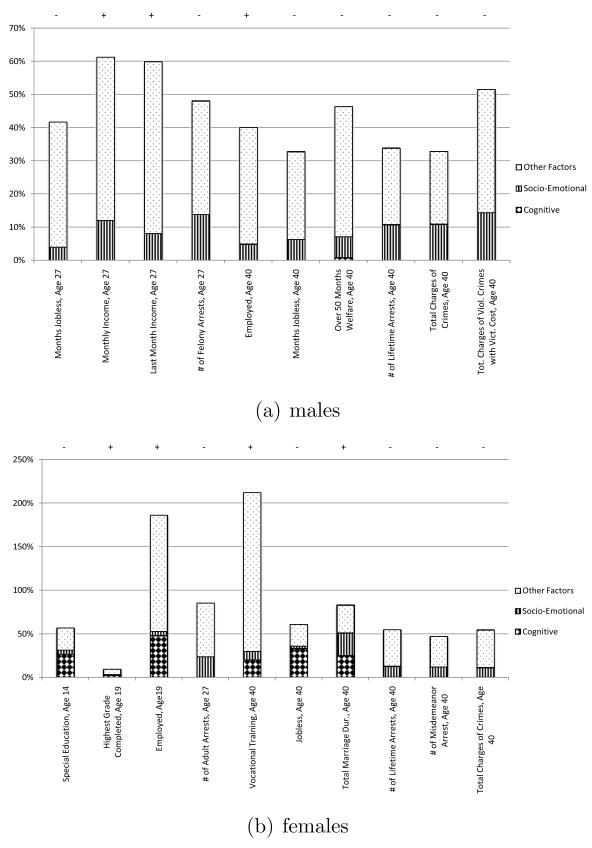
Figure 4.
Decomposition of treatment effects expressed as a percentage gain over control outcomes for selected outcomes by cognitive, socioemotional and other determinants, Perry Preschool Program. Scales differ by gender. Stanford Binet scores at ages 8, 9 and 10 are used as cognitive measures. Scores representing misbehavior at ages 6–9 are used as socioemotional measures. (+) and (−) denote the sign of the total treatment effect. Results are reported for statistically significant treatment effects. The set of statistically significant outcomes differs across gender groups. Source: Heckman, Malofeeva, Pinto, and Savelyev (2009).

