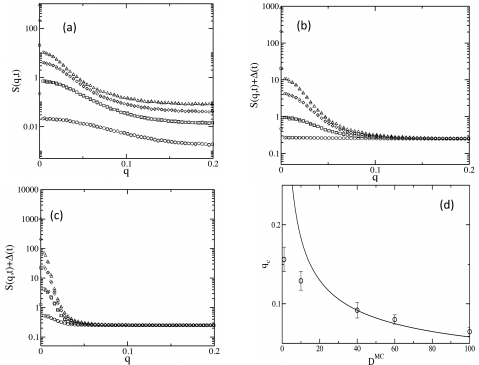
Figure 3.
Characterization of nucleation and domain growth. The structure factor S(q,t) is used to characterize the nucleation and domain growth in the system. All the data are averaged over 1000 initial configurations. (a) shows S(q,t) vs q calculated at times, t=800 MCS (circle), t=1600 MCS (square), t=2400 MCS (diamond), and t=3200 MCS (triangle). The parameters are the same as in Fig. 2a. (b) The data points for S(q,t) in part (a) are shifted by Δ(t), where . For this choice Δ(t→∞)→0, because at long times all the Z particles are converted into X particles, which are eventually homogeneously distributed in space; thus . (c) shows S(q,t)+Δ(t) for DMC=100 at t=2750 MCS (circle), t=3850 MCS (square), t=4950 MCS (diamond), and t=6050 MCS (triangle). All other parameters are identical to that of (b). (d) Dependence of the wave vector associated with the size of the critical nucleus, qc, with the diffusion constant D. We determined the values of qc from the data points where any two curves are, for the first time, separated by a distance that lies within the error bars ΔS in the S(q,t)(+offset\Delta) data in that region. The upper and lower limits in qc are calculated using, ΔS=ΔS∕2 and, ΔS=ΔS, respectively. The solid line shows a function of the form, qc=AD1∕2, consistent with Eq. 2, for comparison.

