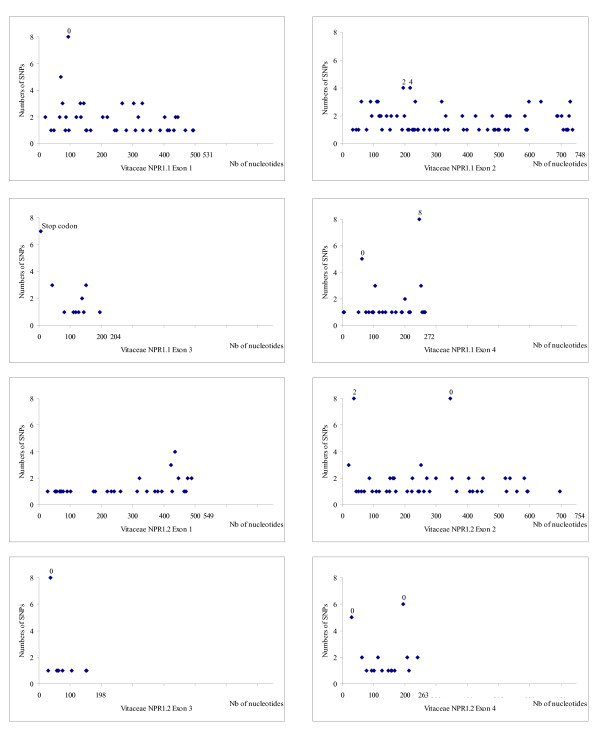
Figure 4.
Distribution of SNPs in NPR1.1 and NPR1.2 along exons 1 to 4. From Ampelopsis japonica, Muscadinia rotundifolia Carlos, Parthenocissus quinquefolia and five American Vitis species. The horizontal scale indicates the nucleotide number. The vertical scale indicates the number of SNPs counted at each position among the eight species in comparison to line 40024. Numbers represent missense substitutions.

