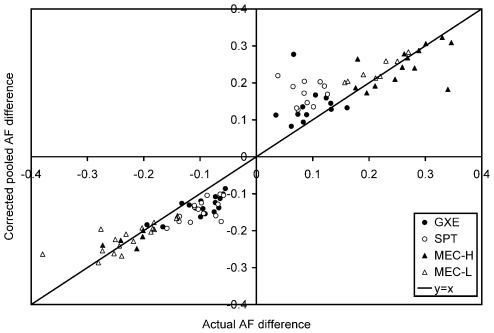
Figure 3. Validation by individual genotyping of the top putative AIMs in the individuals that comprised the pools.
The actual AF difference between the population AF and that of the pseudopopulation was plotted against the corrected AF difference predicted by pooling for 25, 28, 26, and 19 of the top candidate AIMs in MEC-L, GXE, SPT, and MEC-H, respectively. Corrected pooled AF difference was calculated as in Figure 2. Filled circles represent results from GXE, unfilled circles are those from SPT, filled triangles are those from MEC-H, and unfilled triangles are those from MEC-L. In all three populations the classification of a putative AIM as either “encouraging” or “inconclusive” (see Methods) did not appear to correlate with the probability of successful validation (data not shown).

