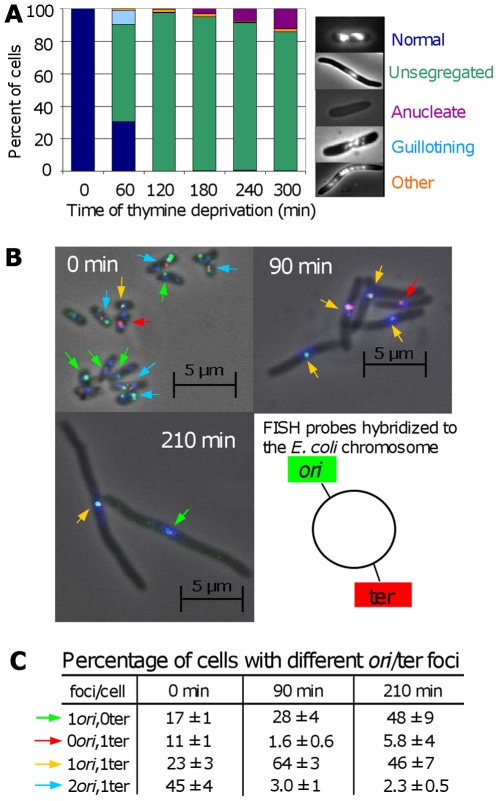
Figure 5. Chromosome segregation and DNA loss during TLD.
(A) Chromosome-segregation defects in E. coli AB2497 during thymine deprivation. DAPI stained DNA appears as bright masses or nucleoids. ∼300 cells scored per timepoint. (B) Representative FISH of AB2497 cells during TLD. Origins, green foci (and arrows); termini, red foci (and arrows); DNA, blue (DAPI). (C) Percentage of FISH-labeled cells with different numbers ori and ter foci showing loss of ori-proximal foci early, and ter-proximal foci late during TLD. 1000, 800, and 530 cells scored at 0, 90, and 120 min, respectively. Images in (B) are merges of 3 separate images taken with filters specific for green foci, red foci, and blue DAPI stain; however scoring of types in (B,C) was performed on individual non-merged filtered images in which only green or only red foci were visible. Mean ± SEM of 3 experiments.

