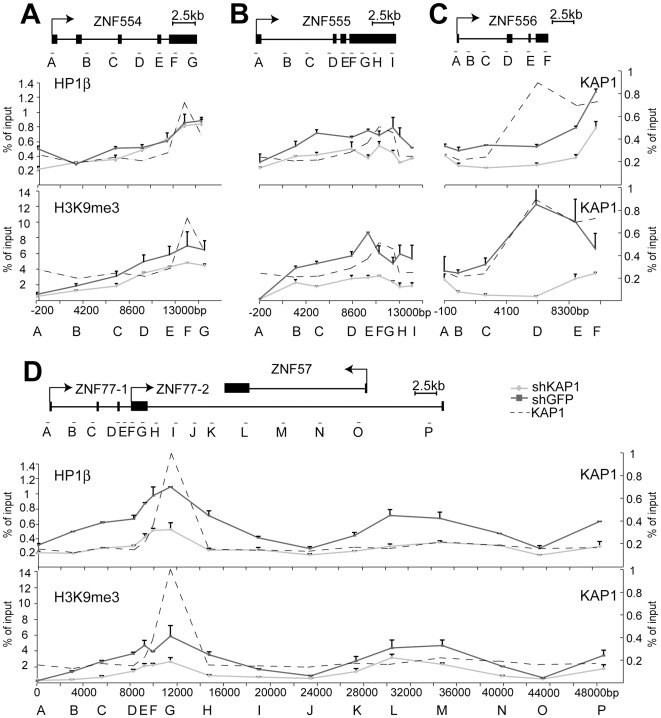
Figure 7. KAP1 mediates the spread of HP1β and H3K9me3 at KRAB–ZFP clusters.
ChIP-mediated measurement of HP1β and H3K9me3 in control (shGFP) and KAP1 knockdown (shKAP1) HeLa cells at the (A) ZNF554 gene, (B) ZNF555 gene, (C) ZNF556 gene, and at the (D) ZNF77/ZNF57 genes. Dotted lines depict the location of KAP1 peaks determined (see Figure 6B–6E). All values are expressed as means +SEM of duplicate experiments. We ensured that comparable amounts of HP1β and H3K9me3 ChIP material were present in our shKAP1 and shGFP cell line by comparing relative enrichment levels at control loci (Figure S8).

